
Maruti Hatchback Sales Rise 41% in H1 FY2027: Rates and September Totals Explained
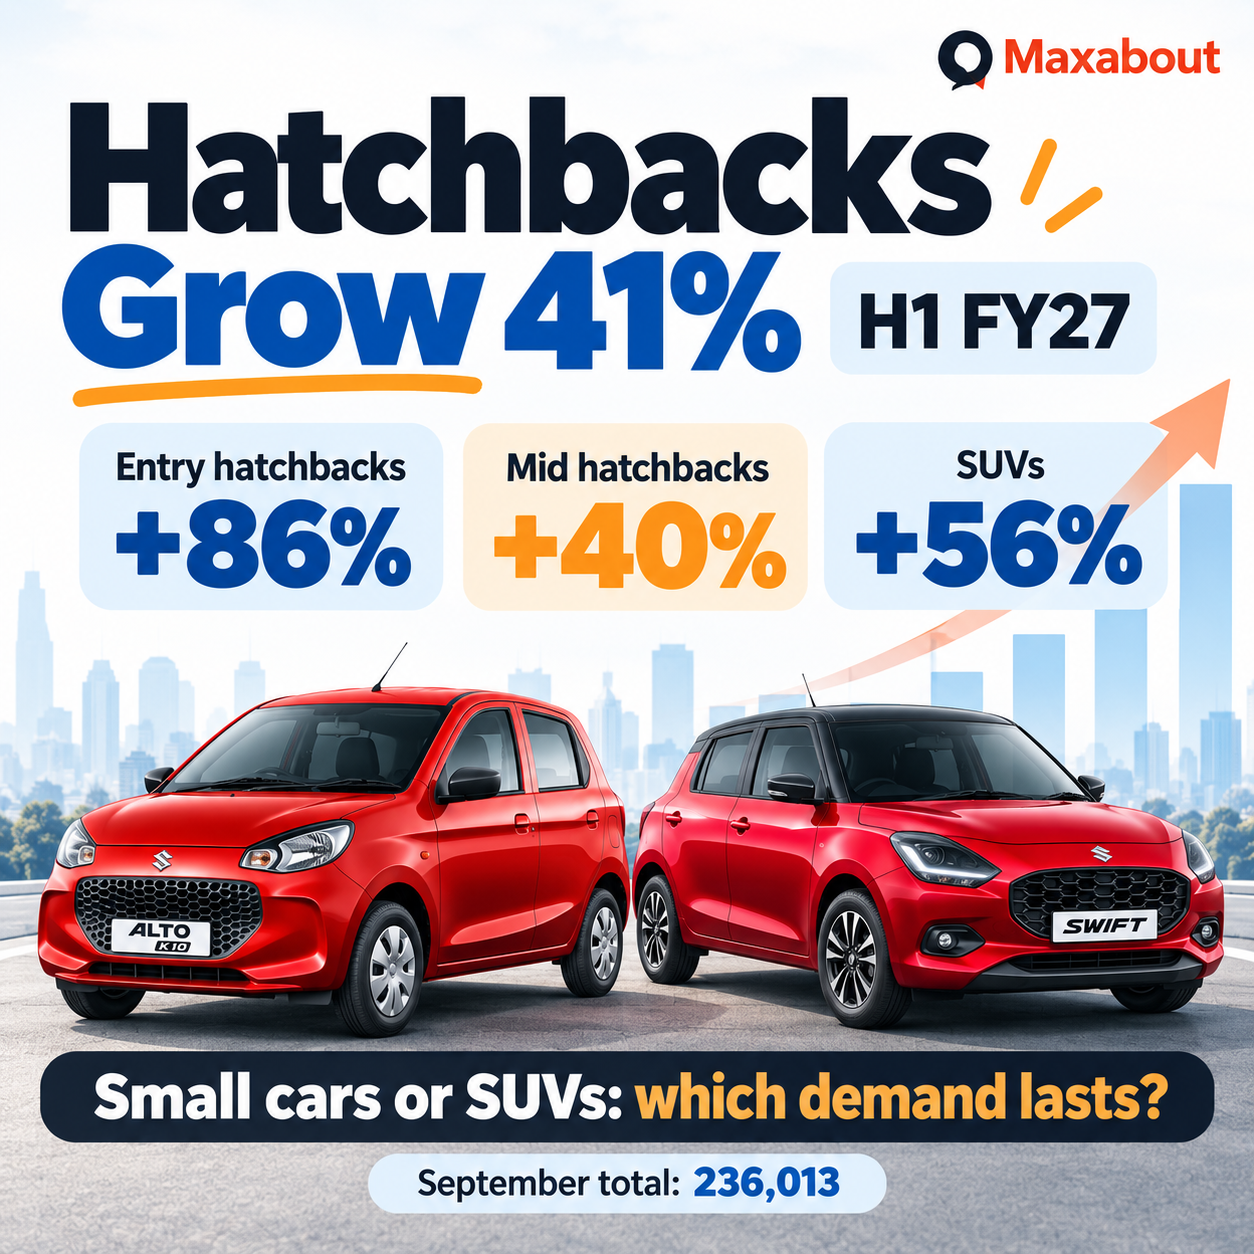
Maruti Suzuki's hatchback sales reportedly rose 41% year on year in the first half of FY2027, covering April–September 2026. The figure was attributed to a company executive, alongside 86% growth for entry hatchbacks, 40% for mid hatchbacks and 56% for SUVs. These half-year segment rates are separat...
Maruti Suzuki's hatchback sales reportedly rose 41% year on year in the first half of FY2027, covering April–September 2026. The figure was attributed to a company executive, alongside 86% growth for entry hatchbacks, 40% for mid hatchbacks and 56% for SUVs. These half-year segment rates are separate from the company's official September total of 2,36,013 vehicles.
What you need to know
The headline hatchback rate is a company-attributed reported figure for April–September.
Entry and mid hatchbacks are subcategories, not additional totals to add to all hatchbacks.
The SUV rate of 56% does not mean SUVs added more units without the comparison bases.
Official September sales comprise domestic sales, supplies to another manufacturer and exports.
These figures do not establish model-level stock or delivery times.
Reported half-year growth by category
| Reported category | Year-on-year rate | Scope |
|---|---|---|
| All hatchbacks | 41% | H1 FY2027 |
| Entry hatchbacks | 86% | Subset of hatchbacks |
| Mid hatchbacks | 40% | Subset of hatchbacks |
| SUVs | 56% | Separate reported category |
The reported rates were attributed to Maruti Suzuki marketing and sales executive Partho Banerjee. This article treats them as an attributed company assessment, rather than a independently reconstructed model-by-model registration dataset. The official September release confirms its monthly total but should not be presented as the document that establishes all four half-year segment rates.
A percentage alone does not provide the underlying volume. A smaller category can grow faster in percentage terms while adding fewer vehicles than a larger category with a lower rate. Without matching prior and current category counts, the four percentages should not become an absolute-volume ranking.
September's official sales breakdown
| September 2026 measure | Vehicles |
|---|---|
| Domestic sales | 1,85,252 |
| Sales to another OEM | 6,542 |
| Exports | 44,219 |
| Total | 2,36,013 |
The three component counts add to the published September total. Supplies to another original equipment manufacturer are a separate reporting line, while exports concern overseas markets. Consequently, 2,36,013 should not be labelled Indian hatchback sales or domestic passenger-car registrations.
The September count also covers one month, whereas the growth percentages cover six months. Placing them next to one another provides context, but it does not make them interchangeable or allow a September hatchback count to be calculated from the headline rate.
What the reported recovery can and cannot show
The company's reported discussion links performance to tax changes and supply conditions. Such explanations are attributed assessments, rather than independent proof of how much each factor contributed. This update does not forecast how long the growth will continue or assume that the same rate applies to every model.
Model classification also matters when comparing reports. A category label should be checked against the actual vehicles included before combining it with another dataset. This article retains the broad attributed rates and avoids deriving model-level volumes from descriptions that cannot be reconciled consistently.
How to use the figures when buying
Industry volumes can help explain the manufacturer's reported business direction, but your choice still depends on the particular vehicle. A strong segment result does not establish a discount, immediate availability or a guaranteed resale value.
Compare the exact variant's written on-road price and equipment.
Ask for stock, manufacturing month and a realistic delivery estimate.
Check whether any offer depends on exchange, finance or a particular stock vehicle.
For market comparisons, match the period, geography, category and whether the figures measure company sales or registrations.
If comparing a hatchback with an SUV, assess cabin space, access, parking dimensions and intended use directly. Reported segment growth is context for that decision, rather than a substitute for a test drive and a clear ownership budget.
Frequently asked questions
What period does H1 FY2027 cover?
April–September 2026.
Can the entry and mid hatchback percentages be added to 41%?
No. They describe subsets and growth rates, not separate additive volumes.
Were 2,36,013 hatchbacks sold in September?
No. That is the wider official company total, including exports and supplies to another OEM.
Does faster percentage growth prove higher absolute sales?
No. The category's starting volume is needed to make that comparison.
Explore the story
Related news





Share your view and join the discussion.
Earn reward points for every comment and get a chance to win ₹1,000 in our weekly lucky draw. Sign in with Google in one tap.
Start the conversation
No one has commented on this article yet. Be the first to share your view.
Want to read more automotive news?
Stay updated with the latest car launches, reviews, and industry insights.
Browse All News