
India Q2 Auto Sales Hit Records: Passenger Vehicles Up 30.7%
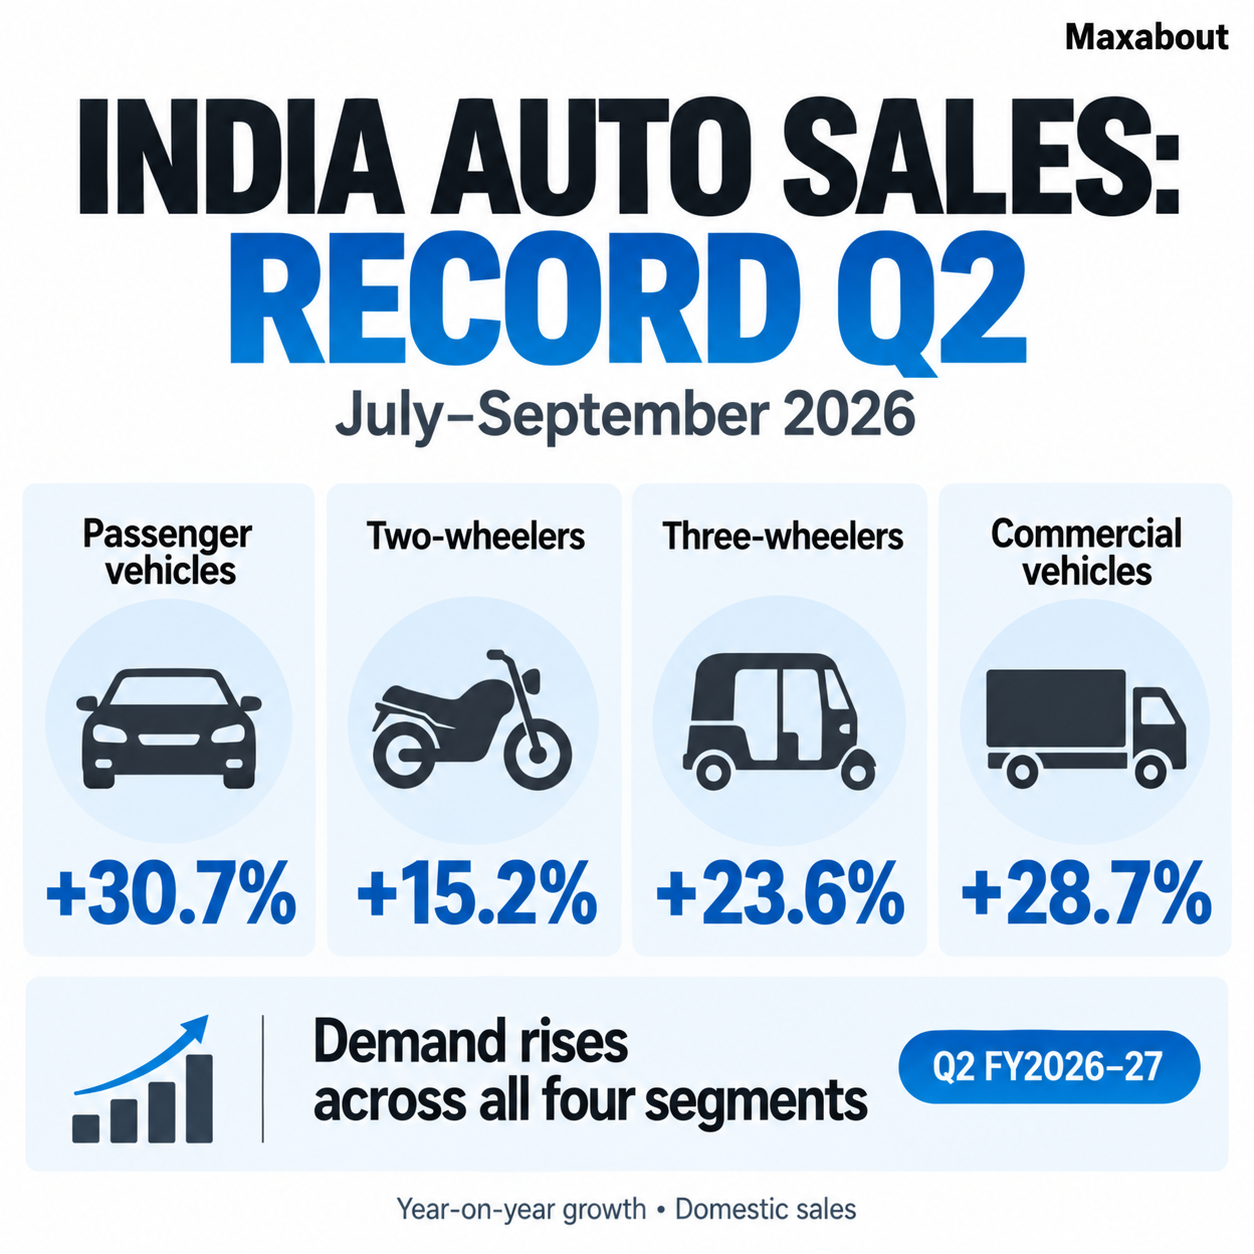
India's passenger-vehicle, two-wheeler, three-wheeler and commercial-vehicle segments all recorded their highest second-quarter domestic sales in July–September 2026, according to the reported industry figures. Passenger vehicles grew fastest, rising 30.7% year on year to 13,60,687 units. The number...
India's passenger-vehicle, two-wheeler, three-wheeler and commercial-vehicle segments all recorded their highest second-quarter domestic sales in July–September 2026, according to the reported industry figures. Passenger vehicles grew fastest, rising 30.7% year on year to 13,60,687 units. The numbers describe Q2 of FY2026–27, and show broad growth across the market rather than a record confined to SUVs or one manufacturer.
India Q2 FY2026–27 sales by segment
| Segment | July–September 2026 domestic sales | Year-on-year growth |
|---|---|---|
| Passenger vehicles | 13,60,687 | 30.7% |
| Two-wheelers | 64,32,842 | 15.2% |
| Three-wheelers | 2,85,342 | 23.6% |
| Commercial vehicles | 3,09,063 | 28.7% |
These are the reported segment figures. Growth percentages compare each segment with the same quarter a year earlier. A faster percentage increase does not mean a larger number of vehicles: two-wheelers remain the biggest of these categories by unit volume even though passenger vehicles posted the higher growth rate.
Utility vehicles dominate the passenger-vehicle mix
Utility vehicles accounted for 9,19,068 units, or about 68% of passenger-vehicle sales. Passenger cars contributed 3,98,631 units and vans 42,988. Utility vehicles grew 34.2%, ahead of passenger cars at 24.9% and vans at 15.3%.
The mix matters because a strong overall passenger-vehicle result can conceal different trends beneath it. The quarter shows growth beyond utility vehicles, while also showing how heavily that category now influences the overall result. It does not establish that every model or price bracket enjoyed the same increase.
Scooters grew faster than motorcycles
Within two-wheelers, scooters rose 27.7% to 26,61,039 units, while motorcycles increased 7.4% to 36,19,853 units. Mopeds reached 1,51,950 units, up 15.4%.
Motorcycles still had the larger quarterly unit count. Scooters' faster growth is therefore a statement about the rate of change, not a claim that they outsold motorcycles. For manufacturers and dealers, the distinction helps explain which part of the market is expanding more quickly without confusing growth with market size.
Commercial vehicles and three-wheelers also expanded
Commercial-vehicle sales reached 3,09,063 units. Medium and heavy commercial vehicles grew 37%, while light commercial vehicles grew 23.8%. Infrastructure work, freight movement, vehicle replacement and fleet expansion were among the factors cited behind the improvement.
Three-wheelers rose to 2,85,342 units. Passenger carriers and goods carriers both grew, but the reported e-rickshaw and e-cart categories declined. An expanding headline segment should therefore not be read as uniform growth across every technology and use case.
What the figures mean for buyers and industry watchers
The growth has been linked to lower prices following GST-related changes, financing support, rural and urban demand, infrastructure activity and a relatively low comparison base. Those explanations help frame the quarter, but the sales data alone cannot isolate how much each factor contributed.
These manufacturer-reported domestic sales figures should also be kept separate from retail registrations. Dispatches to dealers are not a count of individual customers completing purchases in the same period. Nor does a national record guarantee the same stock position, discount or waiting period at a particular dealership.
Exports tell a separate story: passenger-vehicle exports fell 5.2%, while the other major categories increased. A strong domestic quarter therefore does not imply that every part of the automotive business moved in the same direction.
FAQs
Which months are included in Q2 FY2026–27?
The quarter covers July, August and September 2026.
Which segment grew fastest?
Passenger vehicles recorded the fastest year-on-year growth among the four major categories, at 30.7%.
Are these vehicle registration figures?
No. They are industry domestic sales figures and should not be treated as a direct count of retail registrations or individual buyers.
The India Q2 auto sales result shows broad domestic expansion, with utility vehicles shaping the passenger-vehicle mix and scooters growing faster than motorcycles. The useful next comparison is whether that momentum continues across segments, rather than assuming one record quarter guarantees identical conditions for every buyer or manufacturer.
Explore the story
Related news




Share your view and join the discussion.
Earn reward points for every comment and get a chance to win ₹1,000 in our weekly lucky draw. Sign in with Google in one tap.
Start the conversation
No one has commented on this article yet. Be the first to share your view.
Want to read more automotive news?
Stay updated with the latest car launches, reviews, and industry insights.
Browse All News