
EV Insurance Claims: What the Reported 14% Severity Gap Means for Buyers
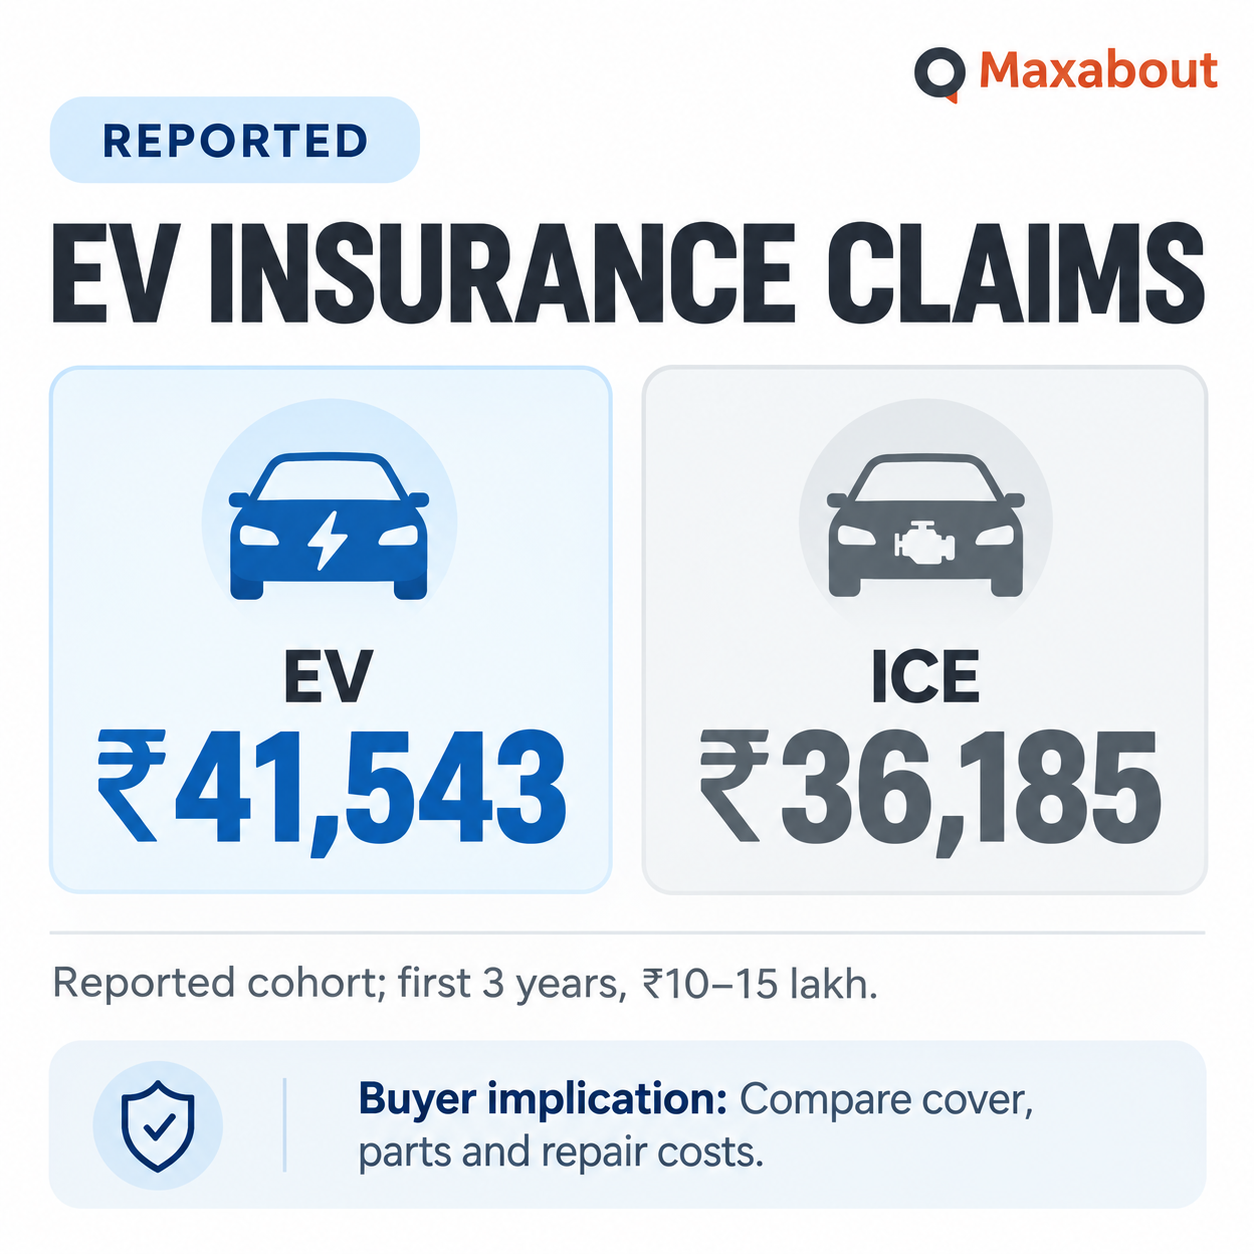
Reported EV insurance claims data puts average claim severity at ₹41,543, against ₹36,185 for comparable internal-combustion cars. The roughly 14% headline gap comes from a restricted cohort: vehicles in their first three years, priced at ₹10–15 lakh, with large-loss claims excluded. It is useful ow...
Reported EV insurance claims data puts average claim severity at ₹41,543, against ₹36,185 for comparable internal-combustion cars. The roughly 14% headline gap comes from a restricted cohort: vehicles in their first three years, priced at ₹10–15 lakh, with large-loss claims excluded. It is useful ownership context, but it does not mean every electric car costs 14% more to insure or repair.
What the reported figures measure
Claim severity describes the average monetary size of claims. Claim frequency describes how often claims occur within an insured group. An insurance premium is a separate price set for a particular policy and vehicle. Confusing these measures would turn a useful dataset into a misleading buying claim.
| Measure | Reported figure | Scope or limitation |
|---|---|---|
| EV mean claim severity | ₹41,543 | First three years; ₹10–15 lakh vehicles; large-loss claims excluded |
| ICE mean claim severity | ₹36,185 | Comparable stated vehicle cohort |
| Difference between reported means | ₹5,358 | About 14.8% of the ICE figure; the report describes the gap as about 14% |
The percentage derived from the two published amounts is approximately 14.8%, so the rounded headline should not be read as a precise universal estimate. No full sample size, observation period, model mix or statistical confidence range was provided in the inspected report.
Claim frequency varies within the EV group
The reported figures also show differences across body styles and city tiers. They describe the dataset's experience and do not establish that body style or location alone caused a claim.
| EV group | Reported claims per 100 insured vehicles |
|---|---|
| SUVs | 31 |
| Hatchbacks | 28 |
| Sedans | 26 |
| Tier-II cities | 33 |
| Tier-I cities | 30 |
| Tier-III cities | 27 |
The body-style and city-tier rows are different groupings, not numbers to add together. Without a disclosed observation period, they should not be presented as annual probabilities for an individual owner.
Battery cover and monsoon exposure
The report also describes battery-protection adoption rising from 51% to 70% over six months among EV owners in their first three years. Add-on adoption is a measure of purchasing behaviour, not proof that a particular policy covers every battery failure.
A separate seasonal comparison gives average severity near ₹65,000 during the monsoon and around ₹52,000 outside it. Those amounts are approximately 25% apart, but their disclosed context does not justify replacing the ₹41,543 EV-versus-ICE cohort average with either seasonal figure.
What Indian buyers should compare before choosing insurance
For shoppers considering electric cars, the useful response is to compare actual cover and quotes for the intended model. A dataset-wide average cannot tell you the premium, excess or approved repair process for your car.
Battery terms: ask which events are insured, including any treatment of water ingress, electrical damage and exclusions.
Own-damage and add-ons: compare limits, deductibles and exclusions rather than choosing by an add-on's name.
Repair support: check the insurer's cashless network and arrangements for the intended EV model.
Written quotations: compare like-for-like insured value and cover before drawing a price conclusion.
These are questions for the policy documents and insurer. They should not be treated as a promise of coverage or a recommendation to buy a particular product.
FAQs
Are EV insurance premiums 14% higher than petrol-car premiums?
That is not established by this comparison. It measures reported average claim severity within a stated cohort, not matched policy premiums.
Does the dataset cover every EV sold in India?
No market-wide conclusion is supported. The inspected report specifies an age and price cohort and excludes large-loss claims, while leaving full methodology unpublished.
Does a higher claim count prove an EV model is less safe?
No. Claims can reflect different types of loss, exposure and usage. The figures do not provide a controlled safety comparison.
The EV insurance claims report highlights why cover details and repair support deserve attention. Its strongest buyer takeaway is to assess the specific car and policy, while keeping the dataset's limits in view.
Explore the story
Related news

Share your view and join the discussion.
Earn reward points for every comment and get a chance to win ₹1,000 in our weekly lucky draw. Sign in with Google in one tap.
Start the conversation
No one has commented on this article yet. Be the first to share your view.
Want to read more automotive news?
Stay updated with the latest car launches, reviews, and industry insights.
Browse All News